I’m asked all the time about what the numbers in top mean, Most admins understand the basics like Memory and tasks but other fields are often miss understood or ignored.
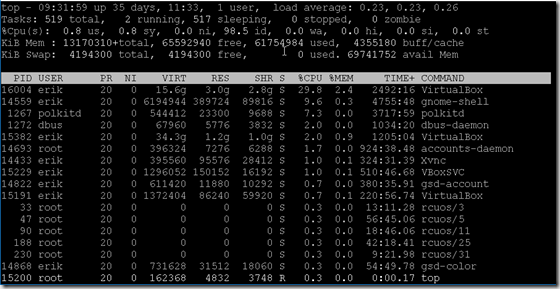
Lets take a look at the following top from one of my Oracle Linux systems;
Lets start with the first line;
The first number is the time; 09:31:59 and how long the system has been running 35 days 11 hours and 33 minutes. The next field shows the number of users logged in, which is one. The final three fields represent the 1,5 and 15 minute load average.
On to the next line!
Here we have an overview of the process information. The total number of processes (519) with 2 running processes, 517 sleeping processes, 0 stopped processes and 0 zombie processes. A stopped process is a Process that has received a STOP signal, and can not continue until it has received a CONT signal. A zombie process is a process that has completed execution but still has an entry in the process table. Normally the init process comes along and cleans the zombies up.
Next up is one of the most misunderstood lines, the CPU consumption;
us: % of CPU spent in user spacesy: % of CPU spent in kernel spaceni: % of CPU spent on low priority processesid: % of CPU spent idlewa: % of CPU spent waiting for disk I/Ohi: % of CPU spent with hardware interruptssi: % of CPU spent with software interruptsst: % of CPU not available by a VM, only seen in virtualized environments
The next two lines deal with memory;
- KiB Mem: Total RAM fee, used and used by the OS as a disk cache and buffers
- KiB Swap, total,free and used SWAP space. Avail Mem is how much ram is available for new processes.
The last fields are the headers for the list of processes;
- PID: The process ID
- USER: The user running the process
- PR: The process priority
- NI: The nice level of a process
- VIRT: The amount of all memory including files on disk, memory shared with other processes etc.
- RES: the amount of physical memory being used
- SHR: Hos much memory is shared memory and libraries
- S:The process state, Sleeping, Running,Zombie are the most common states
- %CPU: Percent of CPU being used
- %MEM: Percent or memory being used
- TIME+: The amount of CPU time the processes has consumed, in Hours:Minutes:Seconds
- COMMAND: The command being run
Hopefully this is of some help, if you have any questions please click on the Contact Me/Ask a Question, or leave a comment below.

