Ever wonder how your ISP is really doing, with the quality of their services? Wouldn’t it be fun to be able to track critical metrics, like bandwidth availability and network latency? While we all think about how fast my internet is, most assume that is bandwidth.
Think of bandwidth as how many lanes on a freeway your ISP offers, the more lanes the more potential vehicles that can travel down that road. A 10-lane freeway can move more cars than a two-lane freeway.. right? A 10 Gb/s network is faster than a 1 Gb/s network…right? As we all know, while the bandwidth/lanes area factor, what really counts is how fast the cars speed down the freeway. This is what latency is all about.
Latency is the measurement of how long it takes for the packet to get from point A to point B, think of it as a way of measuring speed. The faster the freeways, the less time it takes to get from point A to B, regardless of how many lanes, or how much bandwidth, makes up the freeway.
If you are doing things in real-time, like Teams and Zoom calls all day then latency is a very important number to know. Also, over time, seeing the latency slow down over time is often a sign of the degradation of the physical infrastructure that your ISP uses to provide service. Knowing your latency went from 8 ms to 30 ms tells you if have a potential problem. In the past, I have experienced this performance degradation, are it was fixed by replacing the line ( Coax or fiber) between the house and the pedestal. These lines take a lot of abuse from the weather, installers, and just dumb luck. Both coax and fiber lines can be affected. Tracking both the bandwidth and latency is a helpful metric, to understand the quality of your service, and how that quality changes over time.
This is also a VERY useful setup to run at work, even in the cloud. It’s a great way to track the internet performance of your Cloud Provider… more about that in the future.
Now, on to how to set this up. The first step is to install Oracle Linux on the System. Yes, Oracle Linux, the same OS I can run at the office, or in the cloud. It’s easy to install on a Raspberry PI, with not only my directions here on TFTD, but also Oracle’s docs here; https://docs.oracle.com/en/learn/oracle-linux-install-rpi/index.html
In order to get started we need to do a few things;
- Get and install the OKTA Speedtest command line interface
- Install a few programs, like MySQL, Grafana, etc.
- Configure MySQL, setting up the database and table for the data.
- Set up data collection to load data from the speed tests into the database.
- Set up Grafana and import the prebuild dashboard.
Let’s install wget, mysql, grafanna, cron and all the needed bits next. For this install, we will do everything as root.
dnf install chronie firewalld mysql-server grafana grafana-mysql -y
Now let’s grab the speedtest cli, if you head over to https://www.speedtest.net/apps/cli you can grab the URL to download the cli needed for your platform. If you are running this on an Arm platform, from the Raspberry PI to its Enterprise big brother Ampere you will need to get the aarch64 software.
You can download that with this command, but always check for a later version;
wget https://install.speedtest.net/app/cli/ookla-speedtest-1.2.0-linux-aarch64.tgz

Next, lets extract the files. For this example, I am putting it all in /usr/local/bin/speedtest. Go ahead and make the directory, and then cd into it.
mkdir /usr/local/bin/speedtest
cd /usr/local/bin/speedtest
tar -xvf /root/ookla-speedtest-1.2.0-linux-aarch64.tgz

Next, let’s start up a few services that we will need. Crond to automate the data load on a reoccurring basis, mysqld to save the data in a database, and Grafana to report on the history.
systemctl enable –now crond
systemctl enable –now mysqld
systemctl enable –now grafana-server
Next up, we need top open up for firewall ports. You need to open up port 3000 for accessing Grafana, but opening up the mySQL port is optional but recommended. This will let you access the database for external systems down the road.
Add optional remote mysql;
firewall-cmd –permanent –zone=public –add-port=3306/tcp
Add Grafana access;
firewall-cmd –permanent –zone=public –add-port=3000/tcp
Next, we can login to Mysql;
mysql -u root -p
Once you are logged into MySQL, we will need to setup the system to not require a password for local access.
ALTER USER ‘root’@’localhost’ IDENTIFIED WITH mysql_native_password BY ”;
Optionally, you can setup a password for access via the network. In this example, my subnet is 192.168.200.0/24
ALTER USER ‘root’@’192.168.200.%’IDENTIFIED BY ‘MyPassword’;
Next we will need to create the database, called speedtest, and then create the data table.
create database speedtest;
use speedtest;
CREATE TABLE data
(
`server name` VARCHAR(200) NOT NULL,
`server id` int(11) NOT NULL,
`idle latency` float NOT NULL,
`idle jitter` float NOT NULL,
`packet loss` int(11) NOT NULL,
`download` int(11) NOT NULL,
`upload` int (11) NOT NULL,
`download bytes` int (11) NOT NULL,
`upload bytes` int (11) NOT NULL,
`share url` VARCHAR(300) NOT NULL,
`download server count` int(11) NOT NULL,
`download latency` float NOT NULL,
`download latency jitter` float NOT NULL,
`download latency low` float NOT NULL,
`download latency high` float NOT NULL,
`upload latency` float NOT NULL,
`upload latency jitter` float NOT NULL,
`upload latency low` float NOT NULL,
`upload latency high` float NOT NULL,
`idle latency low` float NOT NULL,
`idle latency high` float NOT NULL,
`timestamp` TIMESTAMP NOT NULL DEFAULT CURRENT_TIMESTAMP INVISIBLE
);
Now that the table is built, we will need to give root access to the database.
grant all on *.* to ‘root’@’192.168.%’ WITH GRANT OPTION;
Next up, let’s create a SQL file that will import the data. Copy the following code into /usr/local/bin/speedtest/data_load.sql
use speedtest
LOAD DATA INFILE ‘/var/lib/mysql-files/load.csv’ INTO TABLE data
FIELDS TERMINATED BY ‘,’
ENCLOSED BY ‘”‘
LINES TERMINATED BY ‘\n’;
Next up, let’s create a script that runs the speetest, and imports the data into the database. Copy the following code into /usr/local/bin/speedtest/speedtest_logger.sh
#!/bin/bash
/usr/local/bin/speedtest/speedtest -f csv 2&> /var/lib/mysql-files/load.csv
mysql -vvvv < /usr/local/bin/speedtest/data_load.sql
Now chmod +x the file so it can be run.
Next, let’s test it! If all went well, we should see a row added to the database.
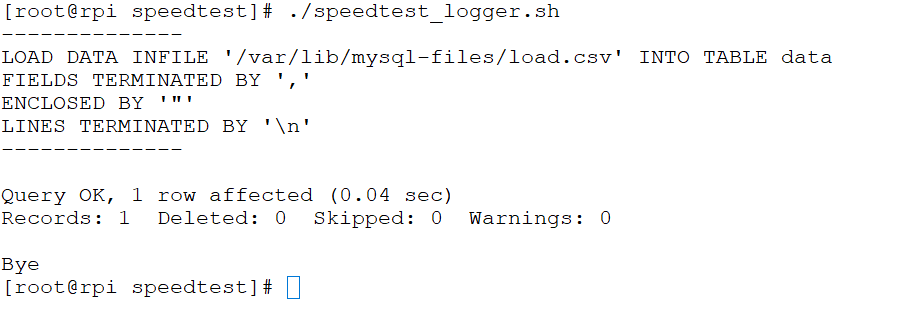
Now, let’s add a cron job to run this every few minutes. You can setup to run as often as you want, but I would recommend not running in too often. Depending on your ISP, you may be charged to the extra data usage. At a minimum I would run this once an hour, but once every 10 minutes is better. This give you a better look into how the internet performs through the day. Use crontab -e to add the following line into your cron system. In my example, I am running every 5 minutes. To run every 10, just change the 5 to a 10.
*/5 * * * * /usr/local/bin/speedtest/speedjob.sh
Last up, is setting up Grafana. Go ahead and point your browser to the Grafana server. It’s URL is the IP address of your PI, on port 300. So in my case, 192.168.200.142 is the PI’s IP. The URL is
Next, log into using the default user of admin, and the default password of admin.
Next, we need to add the MySQL system as a data source.
Navigate to Configuration-> Data Sources
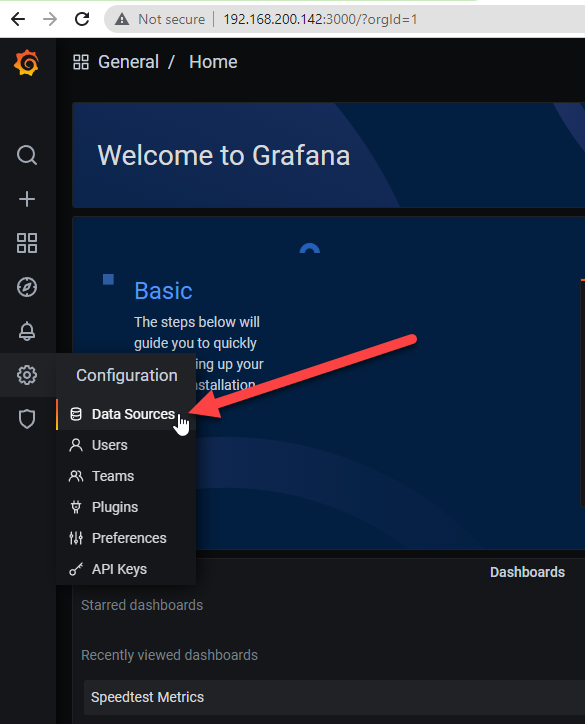
Then select “Add data Source”, scroll down till you see MySQL, and click there.

Next, add the Source. We will name this MySQL. The host is localhost on port 3306, using the speedtest database and the root user. The Dashboard you will download uses this name. So if you change the name, you will need to update the dashboard. We will also make this the default data source for the Grafana server.
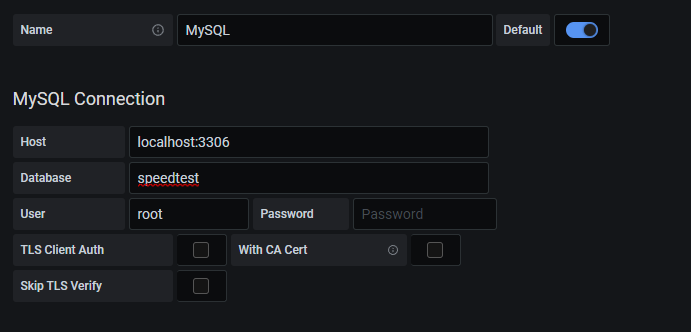
Click “Save and test”
Last, we will import the dashboard I have already made. You can download the JSON here; https://github.com/ErikAstro/Fun-Projects/blob/main/Speedtest%20Metrics-1678655437329.json
Once you have it downloaded, head from the main menu to Dashboards->Manage and click on import

Next we will import the JSON file that was downloaded. Click on “Upload JSON file”

Once you have selected a JSON file, you will get to the import dialog box. As a note, you may need to change the UID, don’t worry about that, just change it to something unique on your system.
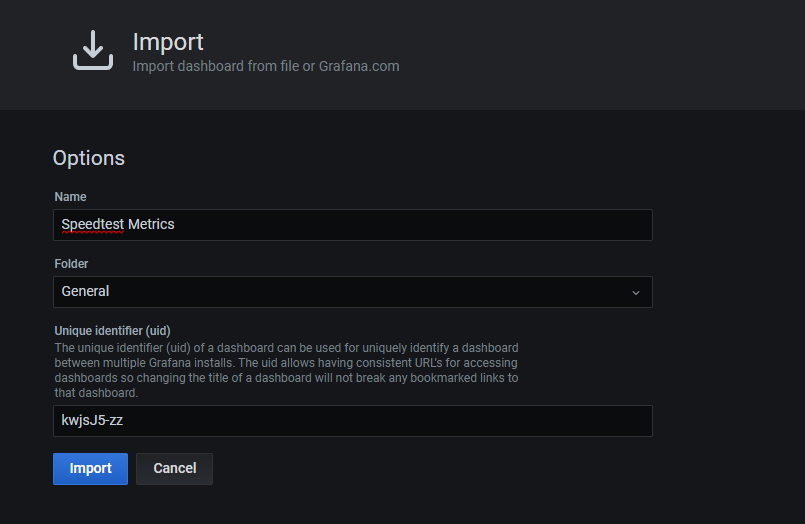
Click on import, and after it completes, you will be redirected to the new dashboard.
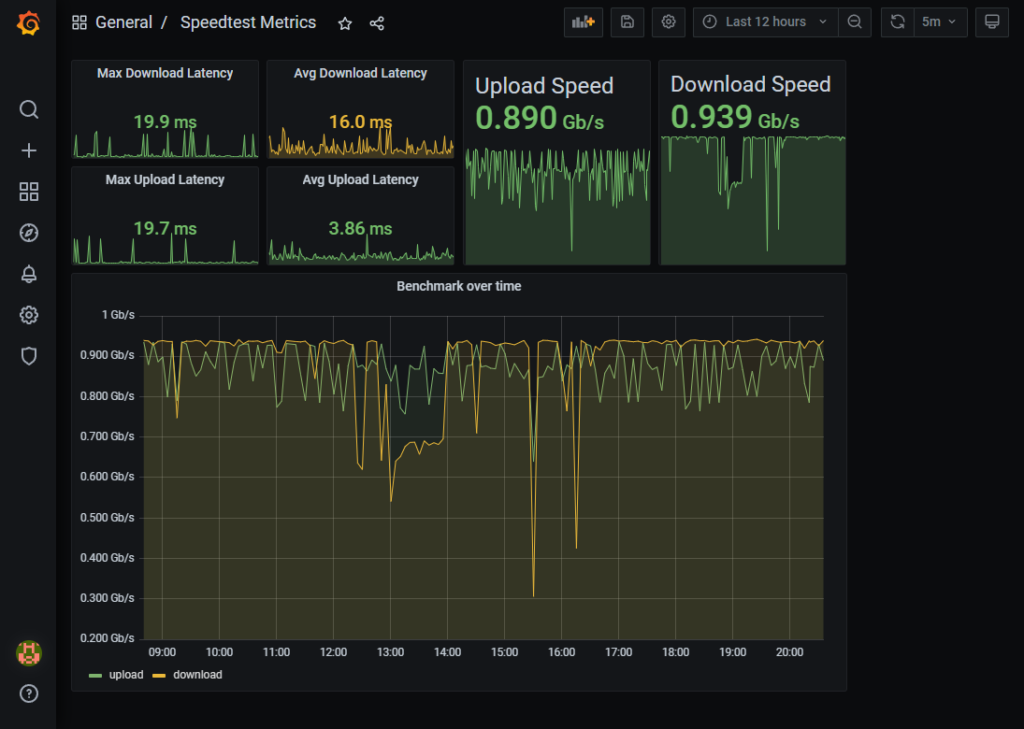
And there you go. If this is a new install, your dashboard will not have as much data, but give it a day to collect.
Hope you enjoy this PI Day project. Feel free to comment below if you have any questions.