If you have not heard, Oracle recently released some new management technology that lets you monitor resources about anywhere they are installed… on-premises, Amazon Cloud, Oracle Cloud… even systems in your basement lab! In this entry of the series I will cover how you can enable the OS level monitoring of a system in OMC Infrastructure Monitoring, and also cover some of the features you get with the tool.
This BLOG assumes that the cloud agent is already installed, check out Oracle Management Cloud – Cloud Agent Install for help with that.
The first task you will need to do is download the JSON configuration files for Infrastructure Monitoring. These are JSON templates that speed up writing the configuration files for the new targets, and include everything from Cisco Switches, to all the major operating systems ( Including Solaris). You can download the file from here;
omc_monsrv_entity_json_samples.zip
As of April 20th, the current list of supported entities is as follows; BUT since this is a cloud technology, new entities are being added all the time. As a note, Enterprise Manager administrators will be familiar with the term target, entities in OMC are a similar concept. OMC updates are published MONTHLY, there is no need to wait a year or two for new features!
- Linux Host (including Oracle Cloud Compute and Amazon EC2 that can be monitored as Linux Hosts)
- Solaris Host
- AIX Host
- Windows Host
- MySQL Database
- Oracle Database (including Database as a Service that can be monitored as an Oracle Database)
- Oracle Database Listener
- Microsoft SQL Server Database
- MongoDB Database
- Tomcat
- WebLogic Server (including Java Cloud Service that can be monitored as a WebLogic Server)
- WebLogic Cluster
- WebLogic Domain
- Apache HTTP Server
- Docker Engine
- Docker Container
- Traffic Director Instance
- Oracle Traffic Director Cluster
- Cisco Ethernet (Catalyst) Switch
- Oracle NoSQL
- Oracle Automation Storage Management (ASM)
- Juniper Ethernet Switch
- Xen Virtual Server/ Xen Virtual Platform
- Infiniband Switch
- Power Distribution Unit (PDU)
YEs, that is a TON of targets/entities that can be monitored out of the box!
Once the JSON samples file has been uploaded to your server, extract it. It will contain the JSON files, that you will use to build your production configuration files.
For the OS, copy the file update_host_sample_1.14_and_on.json to a temporary file, in my case I used host.json.
Next edit the file, changing the “Your local host name that was used for agent install” text to the fully qualified domain name of the server, and the “Your host Type” to the text applicable to your host operating system.
| Linux | omc_host_linux |
| Solaris | omc_host_solairs |
| Windows | omc_host_windows |
| AIX | omc_host_aix |
For my Linux host, the file will look like this;
{
“entities”:
[
{
“name”: “swingbench.m57.local”,
“type”: “omc_host_linux”,
“properties”:{
“capability”: {
“displayName”: “capability”,
“value”: “monitoring”
}
}
}
]
}
The next step is to import the configuration into the agent. Use the omcli command ( I installed omc cloud agent into /u10/omc/cloud ) to do this, passing the parameter update_entity and the json file.
$ /u01/omc/cloud/agent_inst/bin/omcli update_entity agent host.json
Oracle Management Cloud Agent
Copyright (c) 1996, 2016 Oracle Corporation. All rights reserved.
Operation Succeeded: Accepted 1 of 1 entities for processing.
$
You can check the status of the process , using the status_entity agent parameters, and the json file used to configure the agent.
$ /u01/omc/cloud/agent_inst/bin/omcli status_entity agent host.json
Oracle Management Cloud Agent
Copyright (c) 1996, 2016 Oracle Corporation. All rights reserved.
omc_host_linux.swingbench.m57.local : AGENT:entity fully monitored
$
If you omit the json file, the status of all entities attached to the agent will be displayed;
[$ /u01/omc/cloud/agent_inst/bin/omcli status_entity agent
Oracle Management Cloud Agent
Copyright (c) 1996, 2016 Oracle Corporation. All rights reserved.
Lama.swingbench.m57.local:1302 : AGENT:entity fully monitored
omc_host_linux.swingbench.m57.local : AGENT:entity fully monitored
$
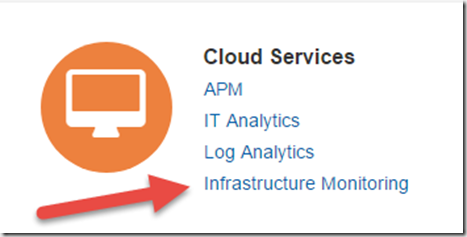
Log into OMC, and select the Infrastructure Monitoring service form the Cloud Services section in the Application Navigator
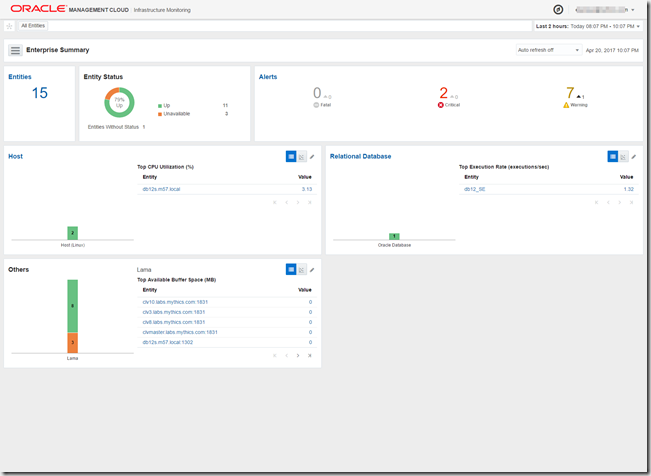
This will take you to the Enterprise Summary page for Infrastructure Monitoring.
There will be six main panes in the window; Entity Status, Alerts, Hosts, Relational Database and Others. Depending on your service other panes may be available or some panes missing.
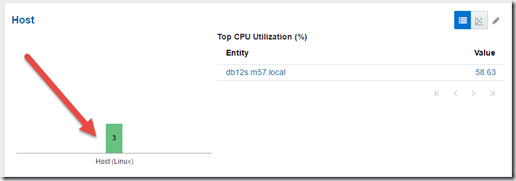
The see your newly deployed agent, click on the Hosts type under the hosts block.
This will take you the the Entitles page, with the Host type filter automatically selected.
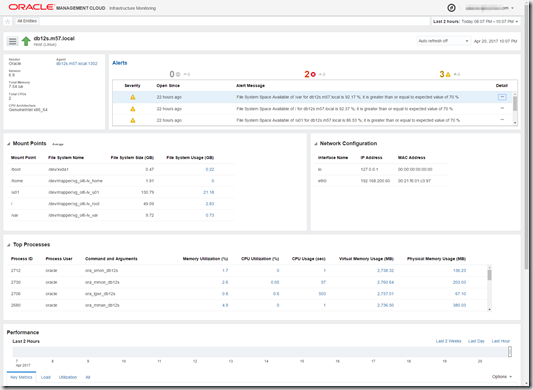
From here select the host to see it’s summary page.
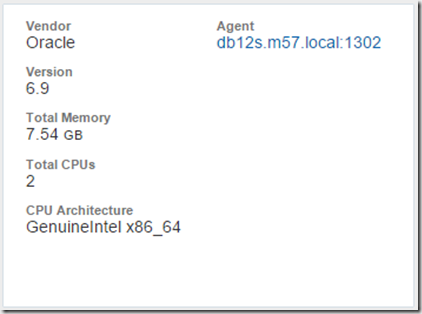
This page will show a lot of information about the hosts, and it’s resources. In the upper left, you will see the host information pane, showing the Vendor, CPU count, total RAM, OS Version, CPU type and Agent link.
To the right of the general info pane, is the alert history. More on alerts in a future BLOG.
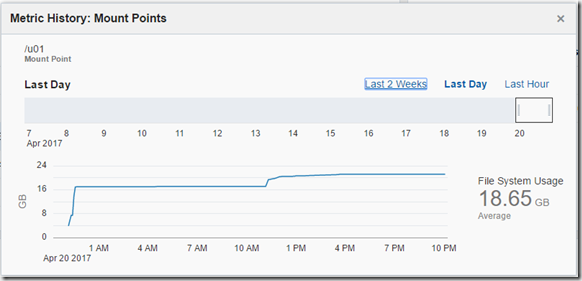
Next is the Mount Points pane, where every file system is displayed.
Click on a file system usage number to see the historical information, as a note, newly discovered hosts will not have any data yet, so that field may be blank for the first few hours.
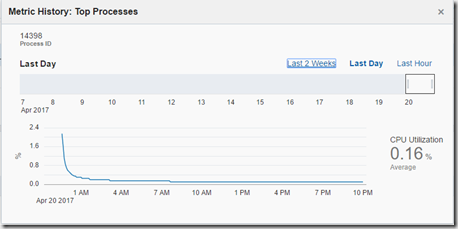
Next, take a look at the Top Processes pane. From here you can view and sort the top processes based on a number of factors, including memory utilization percent and CPU utilization. Clock on a metric to see the history of the metric for the process
Here, we can see that this process consumed more resources a few hours ago, but slowly consumed less through the day.
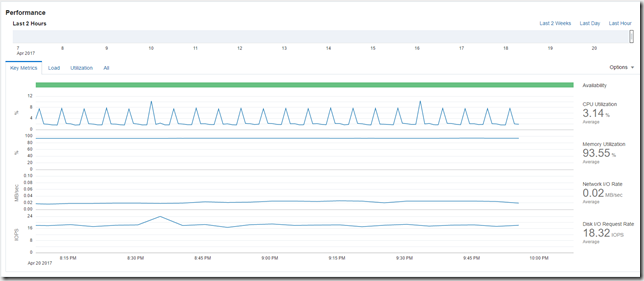
Scroll down the the Performance Section. From here you can graph critical performance metrics gathered by OMC.
This shows CPU, Memory, Network and Disk I/O
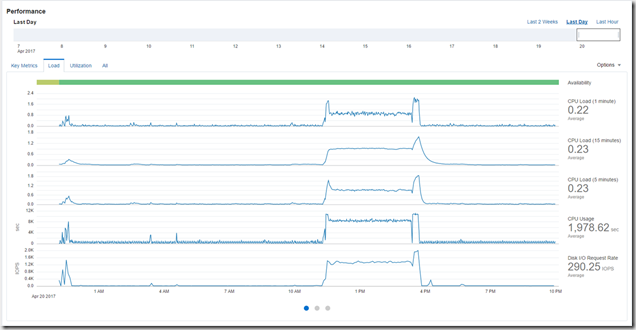
Moving to Load, we see the Linux/Unix Load averages. CPU load, which should never be confused with CPU percentage is a measurement of utilization. In fact, it is precisely the CPU load that is measured, because load averages do not include any processes or threads waiting on I/O, networking, databases or anything else not demanding the CPU. It narrowly focuses on what is actively demanding CPU time. What makes Load even more confusing, is that to understand if the number is a bad or good number, you have to also understand how many cores are available to the operating system. The Load numbers basically represent how many cores are used during the rolling time period shown ( One minute, 5 minutes and 15 minutes ). The load number should never be greater than the number of cores. On a dual core system a load under 2.0 effectively means your in a green zone, and anything over 2.0 is a red zone.
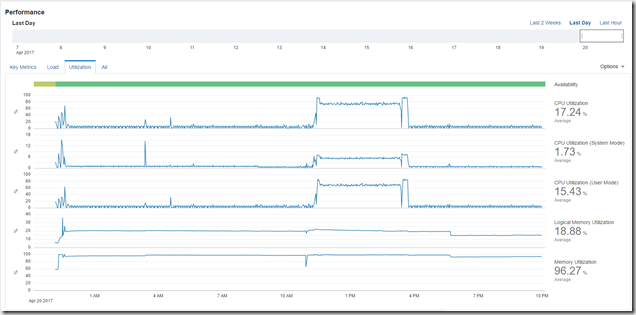
The utilization screen shows the more normal utilization % for CPU and memory.
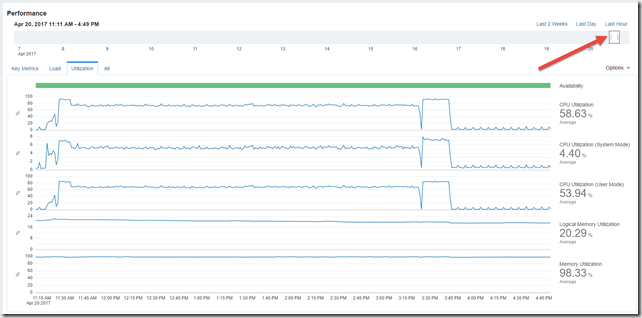
A nice feature with the user interface, you can click on the scroll in the upper right, and change not only the date, but the time range displayed as well. Miss a problem from last week, no worries, you can scroll back and take a look at all the performance metrics OMC is reporting on.
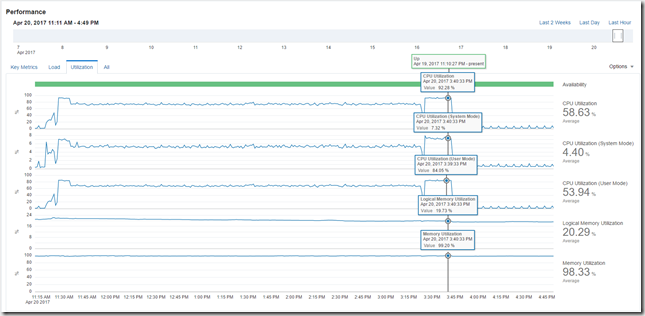
One last trick, is hover your mouse over a spot in the graph. You will get the the details for that time period.
Hopefully this helped you with configuring an OMC Cloud Agent to monitor the OS metrics. Follow this BLOG to see some more content.
