Managing storage needs quickly becomes a bottleneck for the storage admin, unless you use the ZS3 array. The ZS3 software is from the same folks that invented NFS, and includes a user friendly interface to DTrace. DTrace is a dynamic kernel-tracing framework invented by Sun Microsystems. This real-time ability allows the ZS3 admin to monitor and troubleshoot the array in on-the-fly.
Let’s take a quick look at the array management interface, and how DTrace can be used to troubleshoot a common performance issue.
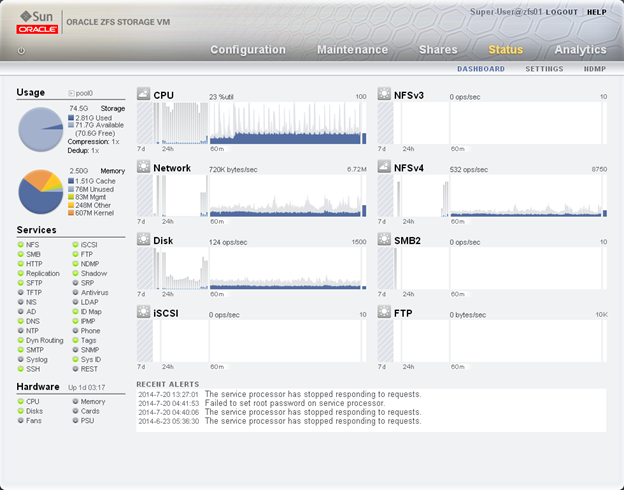
When you first log into a ZS3 array, you see the status page. This screen allows the ZS3 admin to quickly identify issues and overall array health and performance.
In the main screen we also have the ability to drill down into a particular resource. This enables the admin to quickly identify what is consuming array resources. When using file shares, we can drill down to identify the individual file, and the host that is generating the traffic!
Let’s look at how this is done. First, I will use the dd command on one of the servers to generate some additional NFS traffic.
From the main status page, we see a spike in NFSv4 traffic.
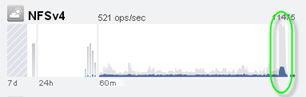
We can click on the graph to start using DTrace Analytics to identify the file and server!
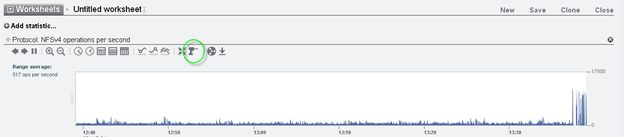
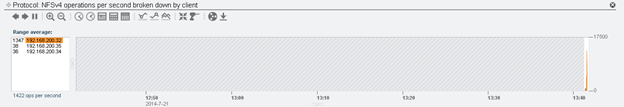
The first graph will show the NFSv4 traffic, and you can see the ops per second increase. Click on the drill icon to drill down for more information.
For this example we will select by client.
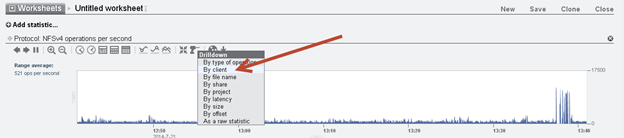
The client drill down will show all the clients using NFSv4, with the number of ops. We can select each client to highlight its number on the graph. For this example, we highlighted the 192.168.200.32 host.
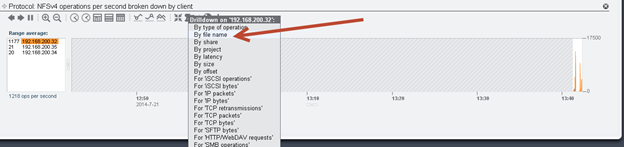
Now to identify the files for this host, select it, and click the drill down button again and select by file name.
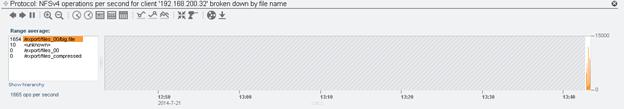
This will now show all files used by the host, with the number of ops per file. We can clearly see that the file “big.file” is consuming the majority of the operations, and that the traffic is generated from the 192.168.200.32 host. I guess I need to stop the dd command now.
As your drill down into a problem, you will build a worksheet, and it will look similar to this.
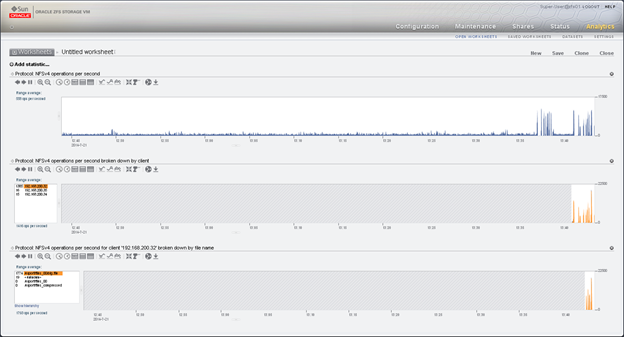
If need be, we can save the worksheet for future use.
This entire DTrace session takes only seconds to perform, enabling real-time troubleshooting if performance issues occur. No special diagnostic files need to be generated and sent to a vendor for lengthy analysis. This is only one of the hundreds of metrics that can be analyzed real-time on the ZS3 series. We can also verify storage latency, RAM usage and even CPU process on the array.