Now that it’s installed, lets see what it can show me about the network. Run
it as root, with the command “iptraf”
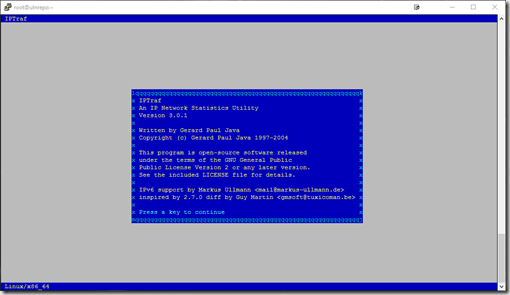
When you first run it, you will get the about screen, showing version and
NU GPL2 license info,
Hit the any key and your now at the main menu. From here you have several
choices;
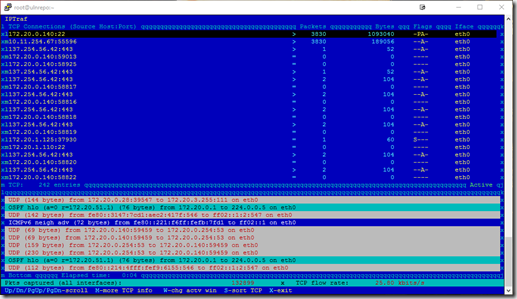
IP Traffic Monitor – This is a real time sniffer, showing IP information and
will display the source and destination traffic on the server, along with the
unusual traffic seen. This is great way to identify what systems are consuming
packets, and if your having issue like network broadcast storms. In this
example, I can see most of my traffic is me sshed into the machine
( 172.20.0.140/10.11.254.67) ,and then multiple sessions of https traffic
to/from 137.254.56.42/172.20.0.140)

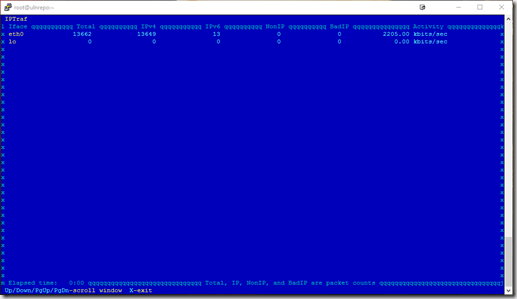
General Interface Statistics – This screen will show interface level stats,
mainly the number of packets and a bandwidth summary for each interface,
The box is currently using about 2 kb/s or about 2.2 mb/s. Not a lot of bandwidth
for a box that is suppose to be downloading a ton of RPMs. Lets look at the other
options too see some more details.

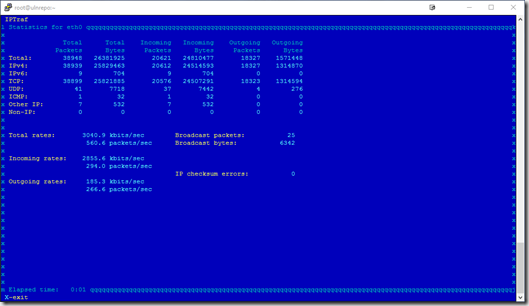
Detailed Interface Statistics- This is a more detailed view of the traffic,
breaking it by protocol and incoming/outgoing packets and bytes.

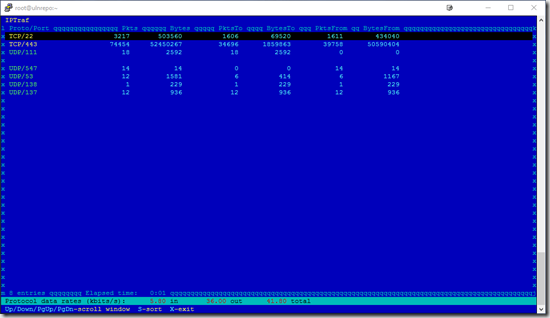
Statistical Breakdown – When you enter this option, you can pick a more detailed
breakdown by either packet size or port. I use port, mainly because I wanted to see
how much https was being moved. While I see traffic other than SSH (22) and httpd
(443), the bulk of the packets are httpd. This is verifying that the download is actually
the number one use of bandwidth.

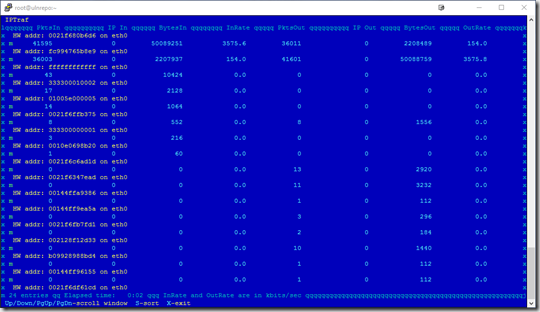
LAN Station Monitor – This is a helpful tool, as it will show the MAC addresses
that the server is talking to. You can also use the S option to sort the display, in this
case I sorted by bytes in. That MAC address happens to be the firewall.

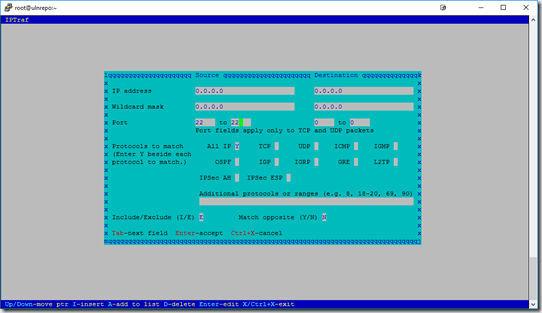
Filters – Here you can define powerful filters, that can isolate a specific host, host
range, port and more. You can also show the opposite of a rule, so in this example
I am going to have the filter display all traffic other than port 22 (ssh). This is VERY
helpful when trying to identify traffic on a busy server. Do not forget to apply the
filter once you define one.

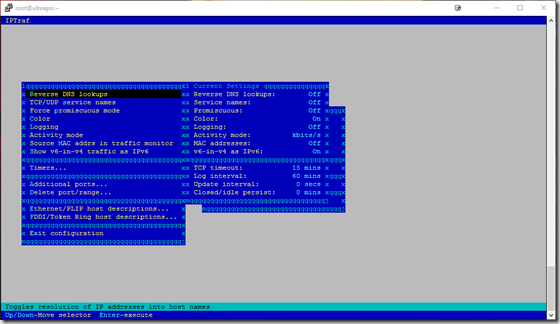
Configure – Here you can set several options, like reverse DNS lookups, timers,
port ranges and more.

Exit – Does what it says, exits the program
While the tool has the nice CUI, you can bypass the menu using a command
line switch. An example is “iptraf –s eth0”, which will take you straight to the
TCP/UDP statistical breakdown. iptraff –h to see all the options.
While, not a long BLOG, hopefully it has introduced to a neat little program, and
will help you better understand an easy way to see what network traffic your Linux
server is dealing with. |

Thank you for the good writeup. It in fact was a entertainment account it.
Glance complex to far introduced agreeable from you!
However, how can we keep in touch?