Let’s just face the facts, without an operational database the application do not work! There a dozens on monitoring tools that do a good gob of monitoring your database when it is in your datacenter, but things are getting really difficult with the latest in application design, where the concept of a single monolithic database is often replaced with smaller databases spread out through the world.Not only is location a challenge, but many modern application snow use multiple database systems, each optimized with a specific task for the application. One great way to monitor this.. mess… is to use Oracle Management Cloud, as it easily can monitor the databases wherever they are, as well as , shockers.. not only Oracle databases! MySQL, Microsoft SQL and other are supported, giving even the most complex environments a true single-pane of glass.
Deploying the Agent is simple, and in this example it will be deployed on an Oracle Standard Edition database, a technology that has in the past not had much monitoring attention from Oracle. Yes, the times have really changed!
First, have OMC Cloud agent installed, and data collecting from the cloud agent. This was covered in a past BLOG here.
The next steps, will configure the database for monitoring, by setting up the listener, and creating monitoring credentials before importing the information from a JSON file into the cloud agent.
For the example, the environment is configured as such;
Host: db12s2.m57.local
Service : db12s2.m57.local
SID: db12s2.m57.local
DB Port: 1521
OMC Display Name: db12s2
First, we need to edit the tnsnames, and make sure the host is in there, as in this example;;
DB12S2 =
(DESCRIPTION =
(ADDRESS = (PROTOCOL = TCP)(HOST = db12s2.m57.local)(PORT = 1521))
(CONNECT_DATA =
(SERVER = DEDICATED)
(SERVICE_NAME = db12s2.m57.local)
)
)LISTENER_DB12S2 =
(ADDRESS = (PROTOCOL = TCP)(HOST = db12s2.m57.local)(PORT = 1521))
Next, we need to make sure that the listener has an objet for the SID. By default this is not setup, but it is easy to add. cd /u01/app/oracle/product/12.2.0/dbhome_1/network/admin/ and edit the config file, so it looks like this;
SID_LIST_LISTENER =
               (SID_LIST =
               (SID_DESC =
               (SID_NAME = db12s2)
               (ORACLE_HOME = /u01/app/oracle/product/12.2.0/dbhome_1)))
Next log into the database, and create the monitoring user. The monitoring user is critical for secure monitoring, with access only to the info needed to monitor the health of the database. In this case I am creating the user “moncs”
To enable monitoring for an Oracle Database, you can create a special database user, for example, moncs as follows.
Create a monitoring role:
create role moncsrole;
Create a monitoring user whose role will be the monitoring role just created.
create user moncs;
Allow the monitoring user to create sessions:
grant create session to moncs;
Grant the monitoring role the following:
grant select on gv_$parameter to moncsrole;
grant select on v_$instance to moncsrole;
grant select on gv_$sql_monitor to moncsrole;
grant select on v_$database to moncsrole;
grant select on gv_$instance to moncsrole;
grant select on gv_$osstat to moncsrole;
grant select on gv_$sga to moncsrole;
grant select on gv_$pgastat to moncsrole;
grant select on gv_$sysmetric_summary to moncsrole;
grant select on sys.dba_tablespaces to moncsrole;
grant select on dba_data_files to moncsrole;
grant select on dba_free_space to moncsrole;
grant select on dba_undo_extents to moncsrole;
grant select on v_$active_session_history to moncsrole;
grant select on v_$ash_info to moncsrole;
grant select on v_$parameter to moncsrole;
grant select on dba_temp_files to moncsrole;
grant select on gv_$sort_segment to moncsrole;
grant select on sys.ts$ to moncsrole;
grant execute on sys.dbms_lock to moncsrole;
grant execute on dbms_system to moncsrole;
grant select on gv_$IOSTAT_FILE to moncsrole;
grant select on gv_$sysstat to moncsrole;
grant select on gv_$sys_time_model to moncsrole;
grant select on v_$event_name to moncsrole;
grant select on gv_$waitclassmetric to moncsrole;
grant select on gv_$sysmetric to moncsrole;
grant select on gv_$system_event to moncsrole;
grant select on gv_$sql to moncsrole;
grant select on v_$system_event to moncsrole;
grant select on v_$alert_types to moncsrole;
grant select on v_$threshold_types to moncsrole;
grant select on v_$sysmetric to moncsrole;
For 12.x versions of the database, also execute the following to grant additional privileges.
grant select on cdb_services to moncsrole;
grant select on gv_$services to moncsrole;
grant select on v_$services to moncsrole;
grant select on cdb_pdbs to moncsrole;
grant select on gv_$containers to moncsrole;
grant select on v_$containers to moncsrole;
grant select on cdb_tablespaces to moncsrole;
grant select on cdb_data_files to moncsrole;
grant select on cdb_temp_files to moncsrole;
/*This statement will fail for non-cdbs, which can be ignored.*/
alter user moncs set container_data=all CONTAINER=CURRENT;
Finally, grant the monitoring role to the monitoring user
grant moncsrole to moncs;
Now make to JSON config files db.json db_creds.json which holds the instance data and monitoring credentials. These files will imported into the cloud agent configuration. All of the cloud agent configuration is managed via the JSON files, which once you get use to it, makes automation a ton easier.
[oracle@db12s2 cloud]$ more db.json
{
        "entities": [{
                "name": "db12s2",
                "type": "omc_oracle_db",
                "displayName": "db12_SE",
                "timezoneRegion": "America/New_York",
                "credentialRefs": ["SQLCreds"],
                "properties": {
                        "host_name": {
                                "displayName": "host_name",
                                "value": "db12s2.m57.local"
                        },
                        "port": {
                                "displayName": "port",
                                "value": "1521"
                        },
                        "sid": {
                                "displayName": "sid",
                                "value": "db12s2"
                        },
                        "capability": {
                                "displayName": "capability",
                                "value": "monitoring"
                        }
                }
        }]
}
and next db_creds.json which has the monitoring credentials of the moncs user that was just created. The password was set to “passw0rd” for the example.
[oracle@db12s2 cloud]$ more db_creds.json
{
    "credentials" : [
        {
            "id" : "SQLCreds",
            "name" : "SQLCreds",
            "credType" : "DBCreds",
            "properties" : [
                {
                    "name" : "DBUserName",
                    "value" : "CLEAR[moncs]"
                },
                {
                    "name" : "DBPassword",
                    "value" : "CLEAR[passw0rd]"
                },
                {
                    "name" : "DBRole",
                    "value" : "CLEAR[Normal]"
                }
            ]
        }
    ]
}
Next we will import the import the files with the following command.
./agent_inst/bin/omcli add_entity agent db.json -credential_file db_creds.json
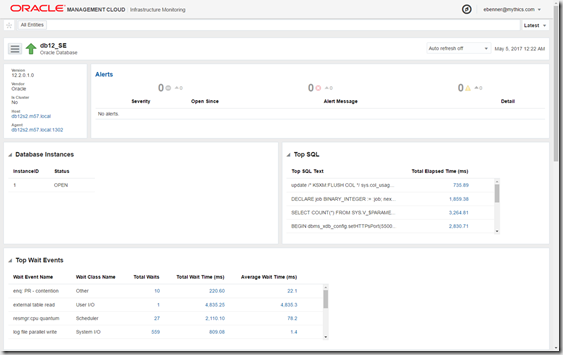
This will run for a few minutes, as the data is uploaded to OMC, once OMC is populated you should see the database in the system. The Entity page will show the database information, any alerts, the Top SWL and wait events
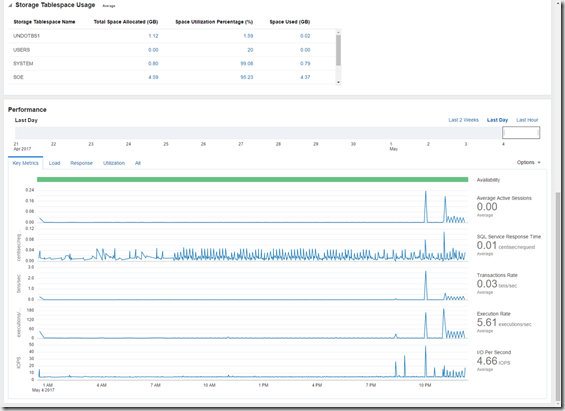
Scroll down a little bit, and you get the tablespace consumption, and performance metrics. As with the other entities, if the field is a link, you can click on it for more information, as well as set alarms based on the data.
As with the OS metrics, the performance section has multiple sections. For The database it has Key Metrics, Load, Response and Utilization.
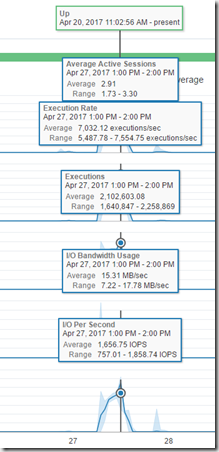
Key metrics includes the Average Active sessions, SQL response time, Transaction Rate, Execution Rate and I/O per Second.
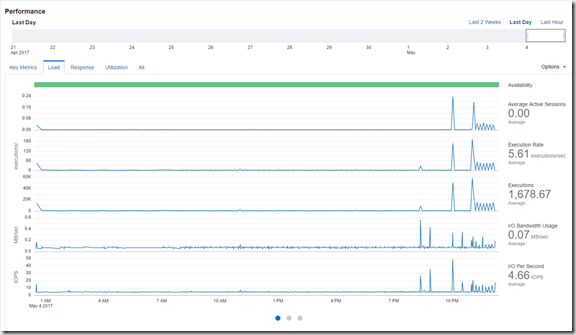
The load shows the Execution Rate, Executions, I/O Bandwidth as well as the Average Active Sessions and the I/O per second.
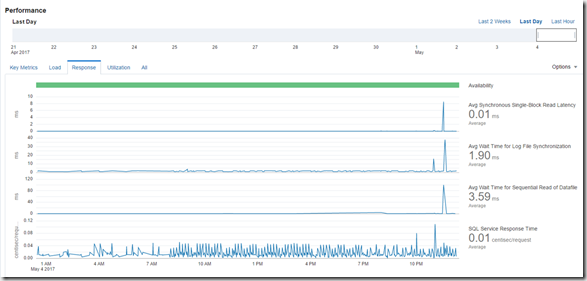
Response metrics show the single-block latency, log file synchronization, average wait for reads and SQL response time
Just as with the other performance pages, you can mouse over a data point, and all the specific data points will be displayed.
You can also scroll back in time to see how the system was performing in the past.
Hopefully, this series of BLOGS about OMC have been helpful. If you have any questions, feel free to use the comments.
How do you configure this on Windows and MS-SQL?
Arun, look for a new post next week that will cover Windows!
Arun, has your question been addressed already? If not, you could try asking in our Oracle Management Cloud community , https://community.oracle.com/community/cloud_computing/platform-as-a-service-paas/oracle-management-cloud/
I’ll make sure your question is being properly answered
@OracleMgmtCloud
hi i have installed cloud agent at windows, now i have to add oracle database as entity.
please explain how to add database in windows
Happy to help. Database directions using the json file are here: http://talesfromthedatacenter.com/2017/05/omc-database-monitoring-for-a-modern-application-architecture/
this is not working for me, I can see dababase entity in OMC, but no metrics, no status info shown.
make sure you created the monitoring credentials.
Thanks for sharing this post,
is very helpful article.