I recently had the chance to talk to a few Hardware managers at a client site, and mentioned in passing that one of the neat tricks you can do with Enterprise Manager 13c, was monitor the physical hardware. A week later, they were calling me back asking how to make that happen, so I took the opportunity to document this process while working on a Netra Module System ( more BLOGs on that system in the near future) this week.
With EM13c, you truly have a single pane of glass, down to the hardware! You can Monitor your systems, check serial numbers, count physical cores and even drill down to the internal sensors in the chassis, like input temperature, fan speeds and even the electrical consumption and metrics!
With EM13c, ILOMs are added as you would any target, using the guided manual process. To do this follow the following steps.
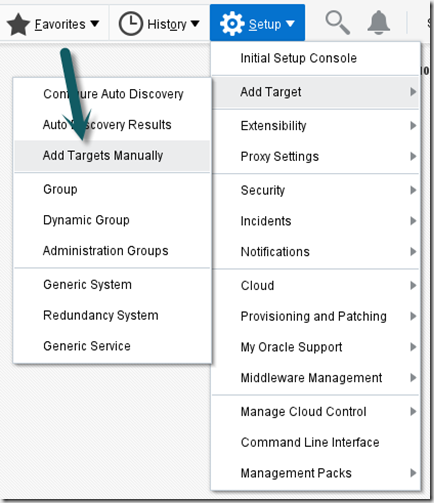
First, log into your EM system, and in the upper right corner select setup->Add target –> Add target Manually
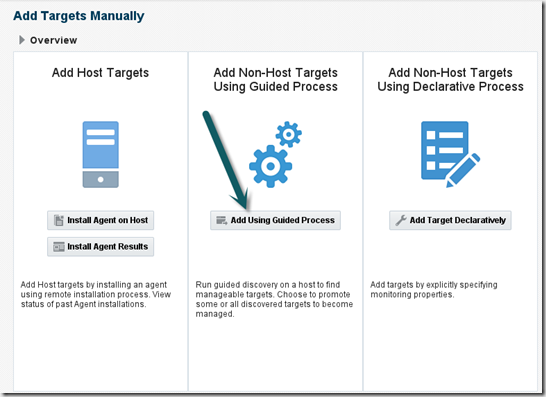
You should now see the Overview page. Since we will be using the Guided Process click there. As a note, this has changed a little when compared to EM12c, but the overall process is similar.
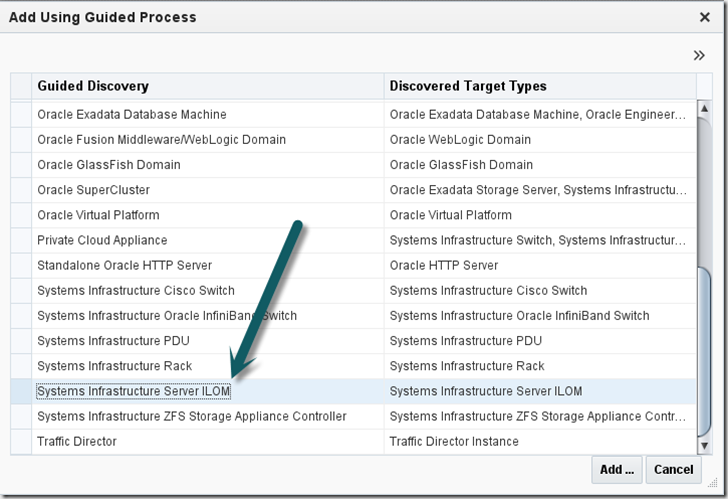
Next, scroll down till you see the Systems Infrastructure Server ILOM Guided Discovery Process. Note, there all all sorts of hardware monitoring processes in EM13c now, so don’t select the wrong one!
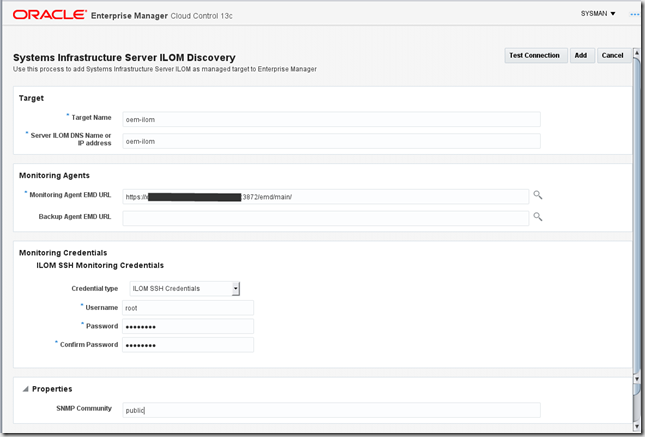
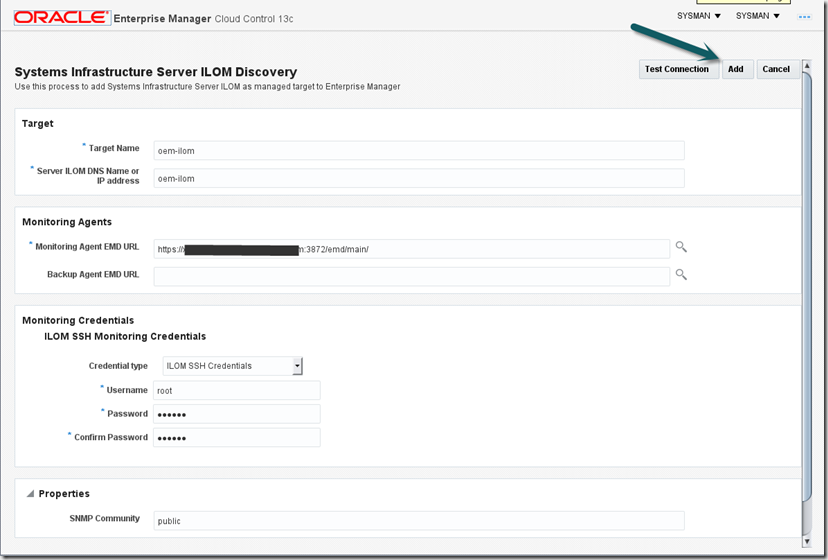
We will no fill in the details, like the target name, IP/DNS info, and the login credentials used to access the ILOM. Being that this was not done in my lab, I have blacked out some of the EMD details, but normally you will use the defaults there.
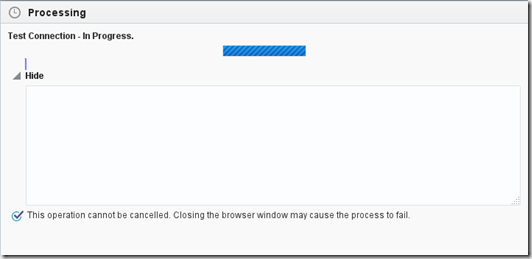
Before you continue, click the “Test Connection” button. This will verify that EM can talk to the ILOM.
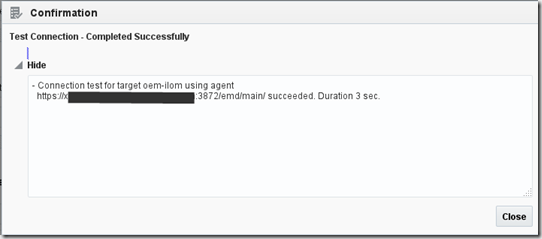
After a few seconds, you should have a pass on the test. If you don’t pass, please verify that the EM server can SSH to the ILOM using the credentials and IPAddress/DNS name you provided.
Next, click on the “Add” button to add the ILOM.
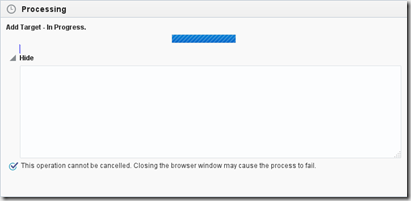
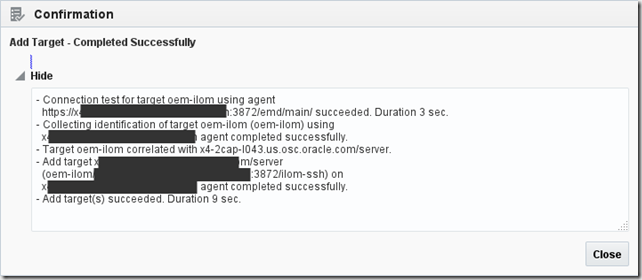
This will run for a few seconds, and you should have the ILOM successfully added now.
Now what do you do next? How about take a look at the new target!
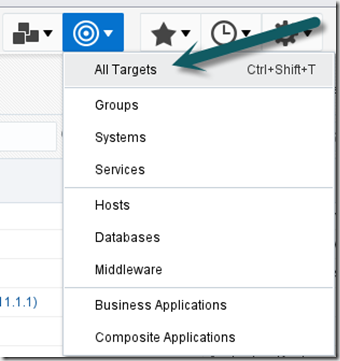
Let’s go find it in the list of EM targets! Click the Target Icon –> All Targets
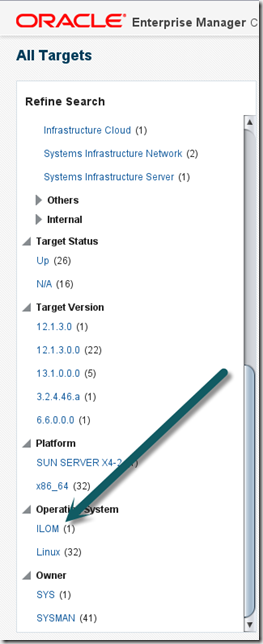
Next scroll down till you the the ILOM under the Operating System
You will now see a list of all the ILOMs, in this case it is just the one. Click on the ILOM now.
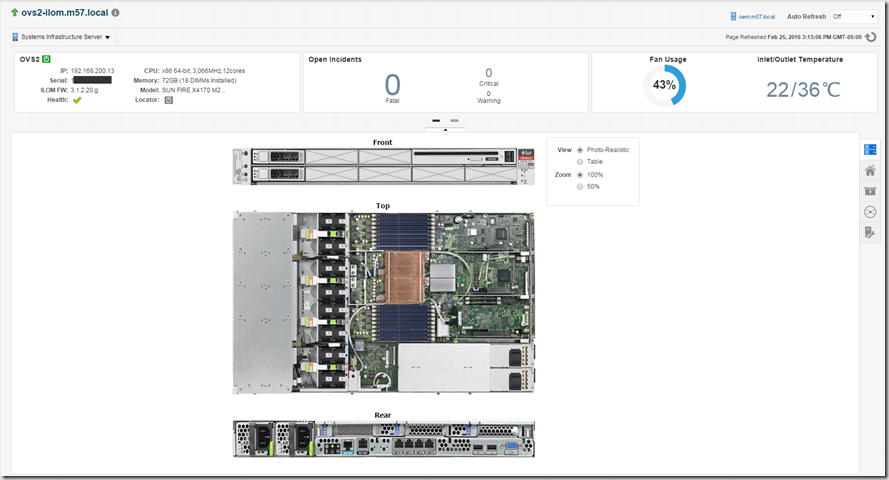
This will take you to the Server’s physical page. If you have not noticed, I did switch to my home lab for this part. I don’t mind folks knowing my server names and since I have been doing this for a while I have some historical data to show. ![]()
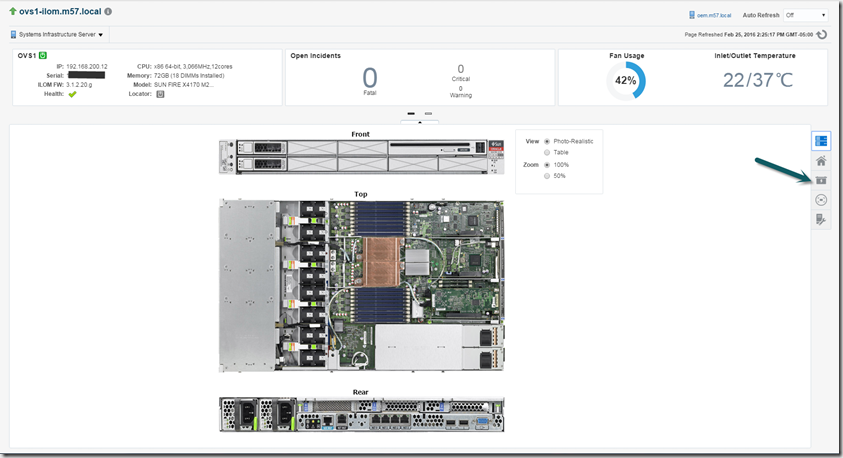
On the lanfing page for the ILOM target, you will see the Photo-Realistic view of the system.
On the right side, you have several views for Hardware, Logical, Power, Network and Service Processor aka ILOM .
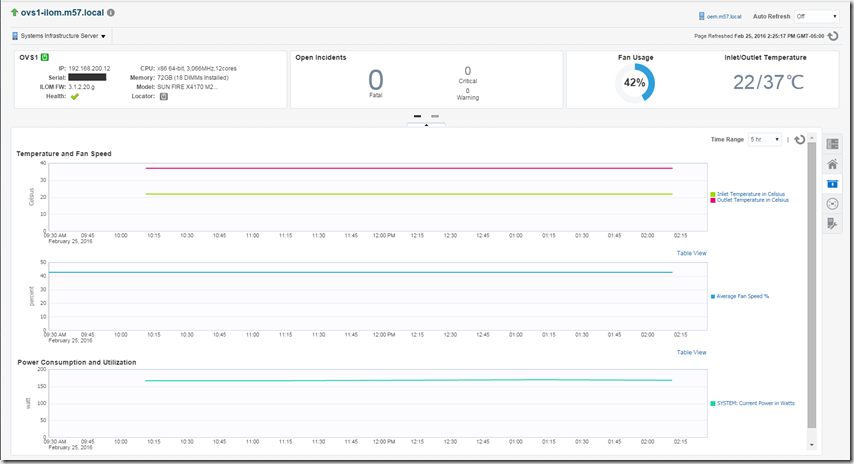
Let’s look at the Power view, and click that icon.
Your now at the power view, showing Fan, Temperature and power status for the last few hours.
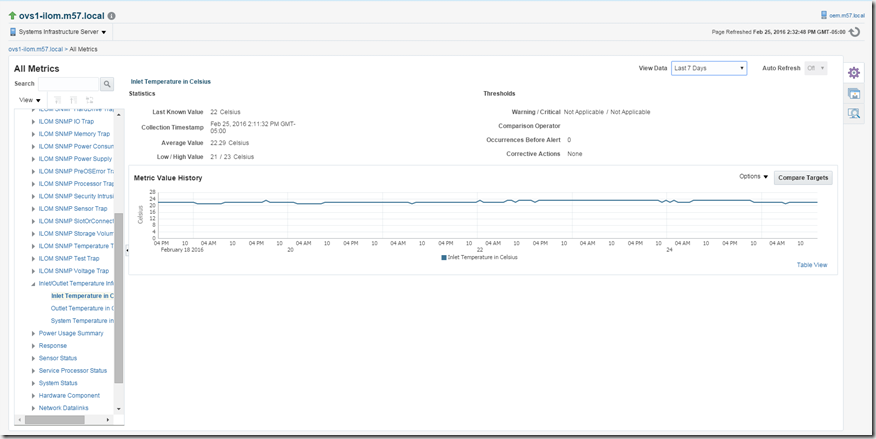
As with almost ANY EM Target, there is more than the summary views. You can also drill down into the metrics to get more information. In this case, we will drill down into the metrics to see the last 7 days of inlet temperature.
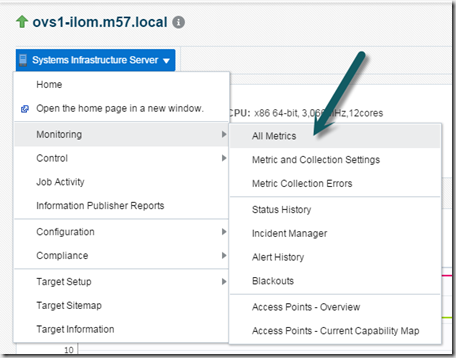
First, click on the Systems Infrastructure Server –> Monitoring –> All Metrics
Now , in the left side scroll down until you see the “Inlet/Outlet Temperature” metric, and expand it to expose the “Inlet Temperature in Celsius”. You can then slect the “View Data” dropdown to show the last 7 days
From the graph you can see my lab bounced with a few degrees, relatively stable. Now pay around with your metrics, and explore the new target type. If you managing the servers, don’t; forget that you can set thresholds to enable alarming of the target!




thanks for the info , its really cool to manage the ilos from enterprise maanger , nice article
thanks
Hello ,
I receive this error, when I try to made a Systems Infrastructure Server ILOM Discovery
ConnectTest;Error: A communication error occurred executing command on target. Target: “ilom-ssh://xxx.xxx.xxx.xx” Metric Collection:
“Real-Time Metric Request” Command: [version] Timeout: 1700 seconds.
Hello ,
I receive this error :
ConnectTest;Error: A communication error occurred executing command on target. Target: “ilom-ssh://xxx.xxx.xxx.xx” Metric Collection:
“Real-Time Metric Request” Command: [version] Timeout: 1700 seconds.
make sure you have the correct credentials configured.
Hi. I am trying to find out how to change the existing credential that was set to monitor ILOM. Can u tell me which screen to go to to change the passwd. We don’t have emcli set up. have to use OEM GUI
The screen to change the password in OEM, or the screen to change the password on the ILOM itself?
Hi, I am having a similar issue as the user above i believe. We have our Exadata ILOMS configured but we have had to change our ilom root password recently. i cannot find anywhere in OEM to change this. Do you happen to know where in OME i would be able to update our credentials?
It’s in the target info for the ILOM. I’ll post details shortly.
I also would like to know where i must align the credential for ILOM in OEM
When you said align , do you mean change the password for the ILOM in OEM?
Yes that is what I asked for
Where is the root ILOM passwd stored in OEM and how to change it (necessary when I change the passwd on ILOM)
( I already replied to this question but looks like it never was published)
Sorry for the slowness, I sometimes forget to look for comments.
The password is stored in the ILOM target under ILOM->Target Setup-> Monitoring Configuration